InfraScale Automation
Engineering a highly technical infrastructure monitoring dashboard.
Project Overview
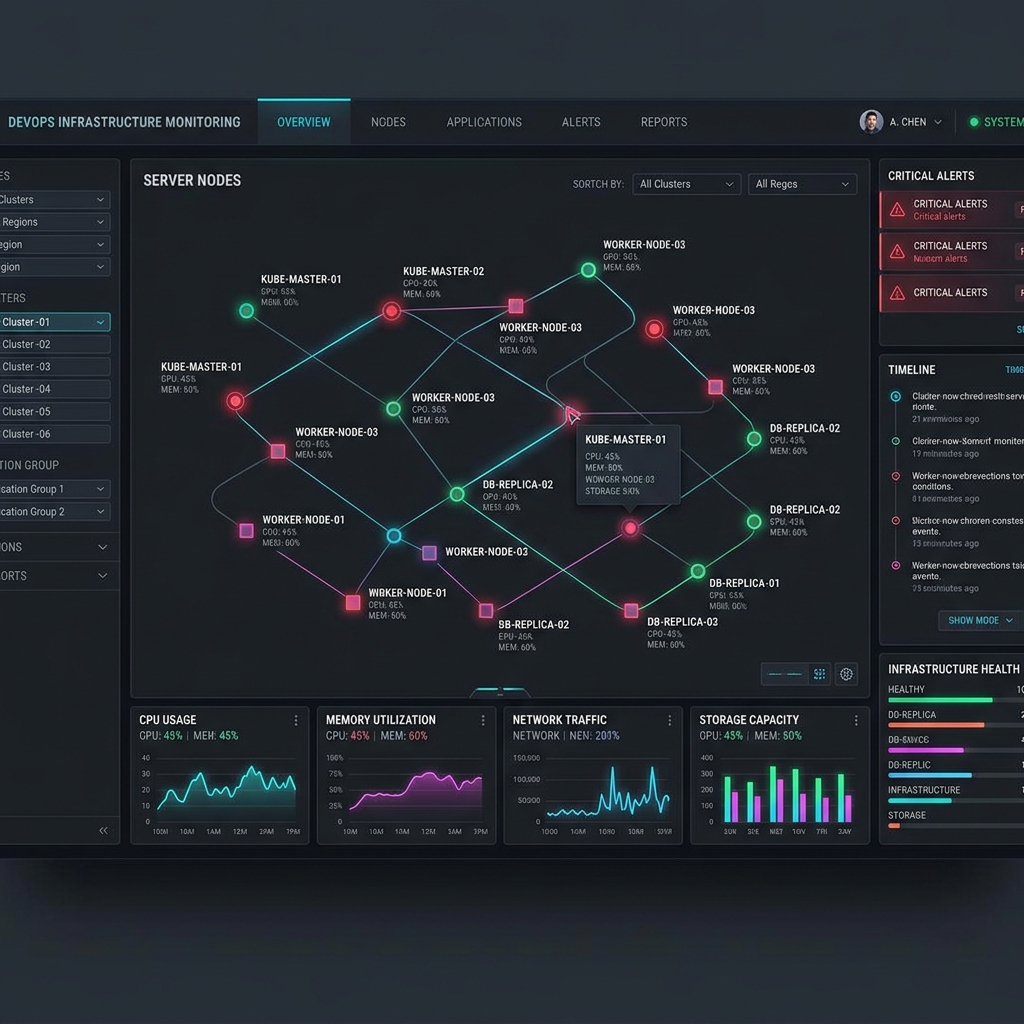
InfraScale Ltd required a robust DevOps monitoring dashboard to provide their SRE teams with real-time insights into server health, node topology, and automated deployment pipelines.
Client Challenge
Visualizing complex, high-velocity data from thousands of Docker containers running across AWS was causing traditional DOM-based dashboards to crash. They needed a hyper-optimized UI utilizing WebSockets for live data streaming without memory leaks.
Technical Architecture & Data Flow
We bypassed standard DOM rendering for the most complex visualizations, utilizing the HTML5 Canvas API within React to draw thousands of server nodes concurrently. Data is streamed in real-time via WebSockets connected to a Node.js aggregation layer that constantly polls AWS APIs and Docker daemon statistics.

DevOps Infrastructure Topology Map
Implementation Timeline
Data Streaming Architecture
Setting up WebSocket connections for live server metrics.
UI Design
Creating a dark, neon-accented aesthetic for optimal visibility in NOC environments.
Frontend Optimization
Implementing Canvas API for rendering thousands of nodes without lag.
Integration & Handoff
Connecting the dashboard to their existing AWS CloudWatch alarms.
"This dashboard is the command center for our entire engineering org. The real-time visibility has prevented several catastrophic outages."
Thomas Anderson, Lead SRE
InfraScale Ltd
Tools & Technologies
Key Learnings & Future Roadmap
We learned that managing WebSocket reconnection strategies in a highly volatile network environment is critical for trust. The roadmap includes predictive outage alerts using anomaly detection.
Results & Impact
Uptime SLA Maintained
Dashboard Latency
Ready to engineer your own success story?
Let our elite team architect a scalable, high-performance solution tailored to your enterprise requirements.
Start the Conversation arrow_forward